Your region and language were selected automatically. You can change this at any time in the menu on the site.
Americas | English

Color Consistency under Different Illuminants

Industrial coatings - A fascinating decoration

alternative

Download PDF

Patchwork might be good for quilts but certainly not for coated industrial goods. As many finished products consist of multiple components which are manufactured by different suppliers and at different locations, uniformity of color and appearance is crucial. Not only the paint batches need to be delivered with consistent quality, but also the production process of the finished product needs to be controlled.

According to Wikipedia the oldest transmitted paint formulation dates back to the 12th century. Since then a lot has changed. Industrial coatings with lower solvent content were introduced resulting in water based systems with almost no solvent. Increasing environmental demands during the last years and requirements for low VOC (volatile organic compounds) systems open the doors for powder coatings with 100 % solids content. Independent of the material, the optical properties of industrial coatings need to fulfill certain quality aspects before they can be applied on the final product.

Color and Gloss harmony

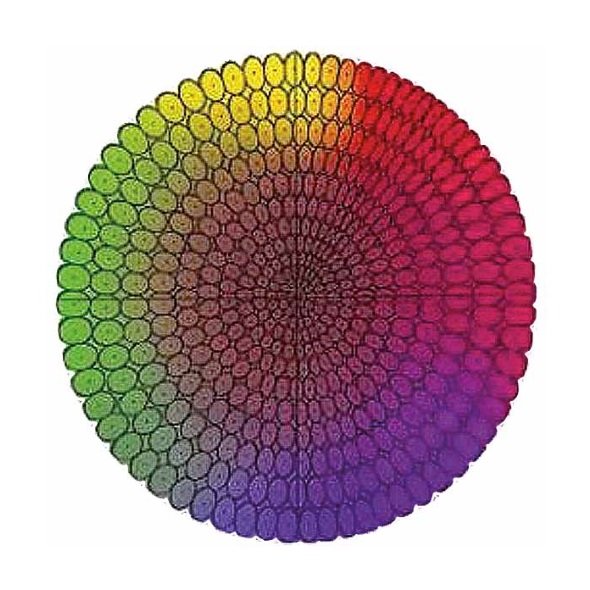
Color consistency from batch to batch is of course a “must” requirement for an industrial coating. The “correct” color has to be ensured across different material types and gloss levels. Color tolerances are dependent on the application and the hue. Studies have proven that CIELab color space is not uniform.

The diagram shows the CIELab color space divided into a multiple number of ellipsoidal micro-spaces. All colors within one ellipse are perceived as the same color. It can clearly be noticed that the size and shape of the ellipses are different dependent on the hue. Additional, chromatic colors have larger ellipses than achromatic colors and a difference in hue is more obvious than a difference in chroma.
CIE-Lab-Color-Space-590x590.jpg
Spectro2Guide-590x590-RGB.jpg
Therefore, tolerances need to be defined by color families and differently for the individual color components (ΔL*a*b*C*H*). Over the years, new color systems and equations for solid colors were developed based on visual studies: e.g. ΔECMC– ΔE94 – ΔE99 – ΔE2000. They correct for the non-uniformity of CIELab color space and improve visual correlation. Additionally, the major advantage of these equations is that one tolerance can be used for all colors.

spectro2guide includes all new equations and even simultaneously measures 60° gloss to ensure complete appearance harmony.

Color consistency under different illuminants

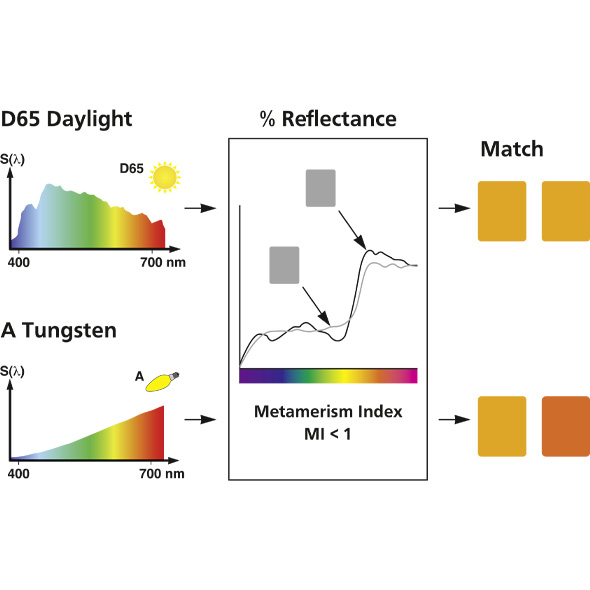
As multi-component products are utilized under different lighting conditions, color consistency needs to be checked under multiple light sources as well. Otherwise parts painted with different batches have the potential risk to appear the same under daylight but show an apparent mismatch under indoor room lighting. This phenomenon is known as metamerism.

Visual test of metamerism
In a light booth standard and sample are viewed at the reference light source – most of the time D65. Then the light source is changed to at least one test light source which is significantly different from the reference light source. A common practice is to visually evaluate the sample pair under illuminant A and a fluorescent light source representing TL84 or CWF. This can be easily done using the byko-spectra pro lighting cabinet. The light booth supports commonly defined standard illuminants and an automatic sequencing of different light sources for standard testing procedures can be programmed.
Metamerism-Index-590x590.jpg
Color-difference-590x590.jpg
Instrumental test of metamerism
The reason for metameric paint batches is that the pigments or colorants used in the formulation are different. This can occur when e.g. raw materials are no longer available because of environmental issues or more cost efficient solutions require raw material changes. In any case, the spectral curves of the metameric pair are different. Typically the curves cross each other at least three times.

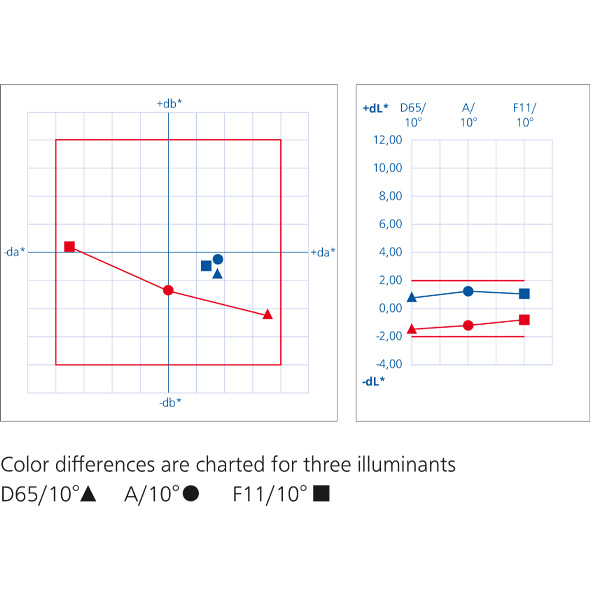
However L*a*b* values calculated for one illuminant are the same for both specimen, but are different for a second and third illuminant. The graph on the left shows measurements taken with the spectro2guide. The red line represents a metameric sample: the Δa* and Δb* values are significantly different for illuminant D65, A and F11 (TL84). In comparison the sample charted in blue matches very similar for all three illuminants. Therefore, it is not metameric.
Subscribe to our Newsletter and stay informed! subscribe
CANCEL